Posts Tagged ‘Learn Swing Trading Strategies’

Swing Trading BLOG – Week in Review February 10, 2012

Sunday, February 12th, 2012

Swing Trading BLOG – Swing Trading Boot Camp
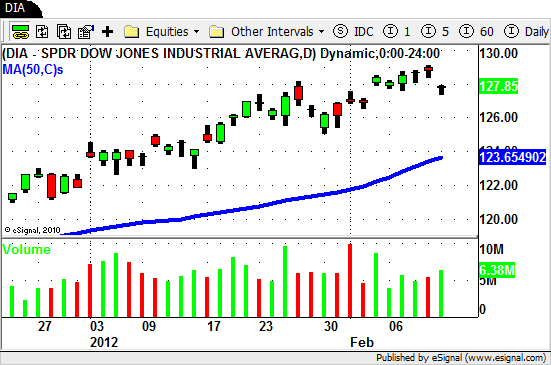
$DIA - Swing Trading ETF

The Rally continues but…

The market drifted higher this week extending the rally that started at the beginning of the year.

So where does the "but" come in?

Well Fridays price action left swing traders wondering if the market has reached its peak (at least for now).

Friday traders watched as the market GAPPED DOWN and sold off in the morning only to rally and close at its high.

The sector action was interesting as well. We watched as some of the strongest sectors either "stalled" or began to pullback even as the overall market pushed higher.

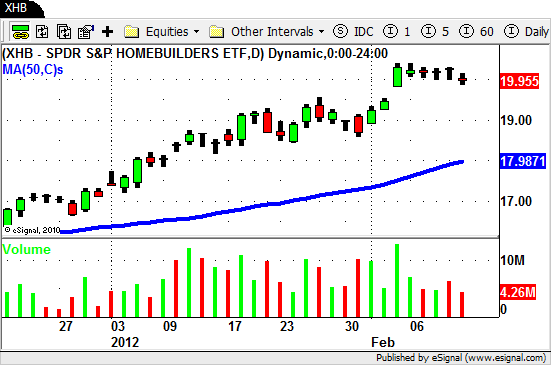
The ultra strong Homebuilders ETF ($XHB) traded sideways all week.
$XHB - Homebuilders ETF

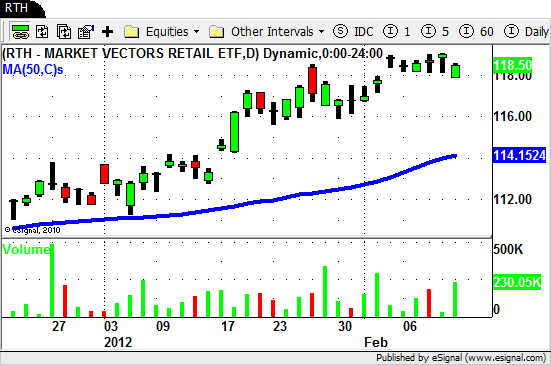
The Retail ETF ($RTH) did the same.

$RTH - Retail ETF

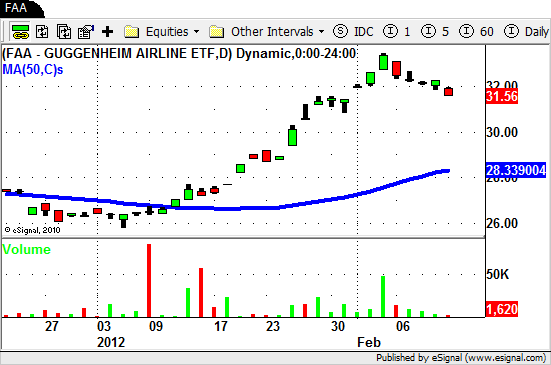
The Airlines ($FAA), Real Estate ($IYR) and Materials ETF's all started to retrace this week.
$FAA - Airlines ETF

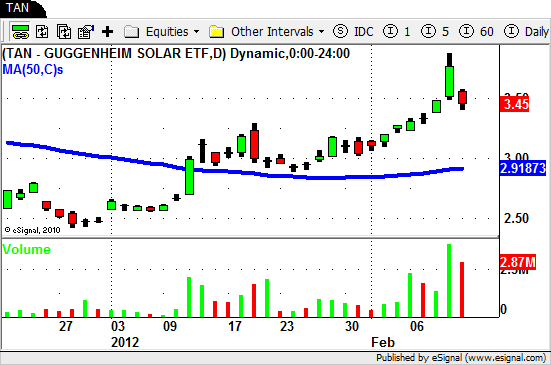
One sector to watch that outperformed the market this week was the Solar ETF ($TAN).
$TAN - Solar ETF

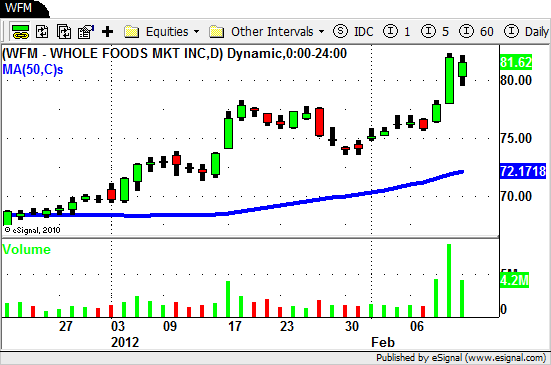
As far as individual names go there were some great moves and the charts still look great.

$NE, $HAR, $AKAM, $V, $VECO, and $WFM turned in a great week!
$WFM - Swing Trading Stocks

As we look at the swing trading charts we see a lot of stocks that are still looking very bullish.

Some of the best swing trading indicators are flashing signs of being "overbought" though.

The overall market does continue to show signs of being a bit extended and Fridays trading action leaves us wondering what next week will bring.

So what do swing traders do in a time like this?

Stay true to your plan.

You see  we always have a plan…and so should you!

We know exactly what we will do if the market turns down to make a run back towards the 50 day SMA.

We also know what we will do if the market jumps out of the gate on Monday and rallies to new highs.

We have our plan in place well before the market opens each and every day.

Do you know exactly what you will when the market opens on Monday?

Have a plan in place BEFORE the market does whatever it is going to do.

Once it does simply take action based on the plan you have already laid out.

Not only is trading a lot less stressful when you do this it also helps take the emotion out of your trading decisions.

Until next week…Good Trading to YOU!

Swing Trading BLOG – Week in Review – July 22, 2011

Sunday, July 24th, 2011

Swing Trading BLOG – Swing Trading BOOT CAMP

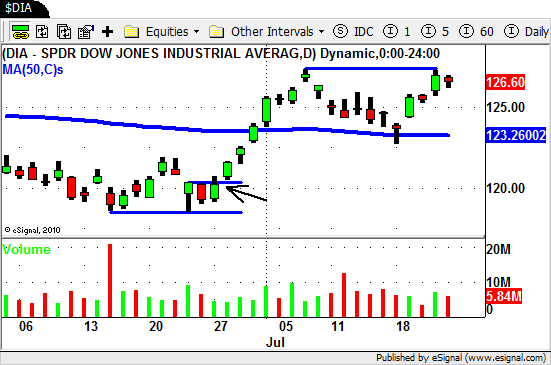
$DIA - Swing Trading ETF

Nice follow through this week!

After a spike down below the 50 day SMA on Monday the market found its footing and resumed its move to the UP side this week.

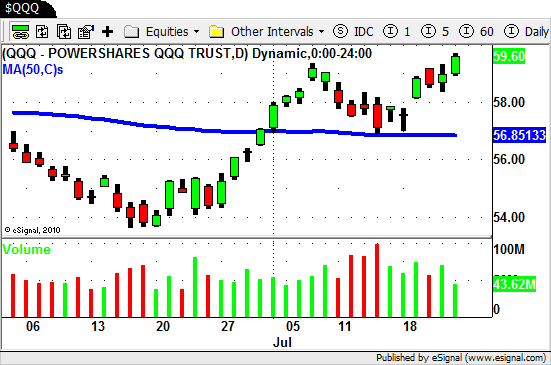
As far as the indices are concerned the NASDAQ actually rallied up to a HIGHER HIGH while the DOW and S&P lagged behind a bit.

$QQQ - Swing Trading

As expected the overall market did well but a few sectors really stood out.

Here is a look at the charts for a few of the sector ETF's that performed well.

$XLE

$XLE - Swing Trading ETF

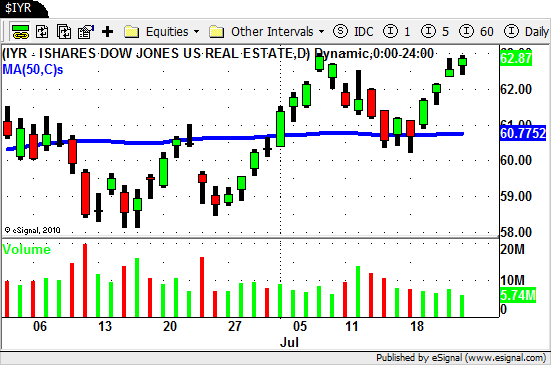
$IYR

$IYR - Swing Trading ETF

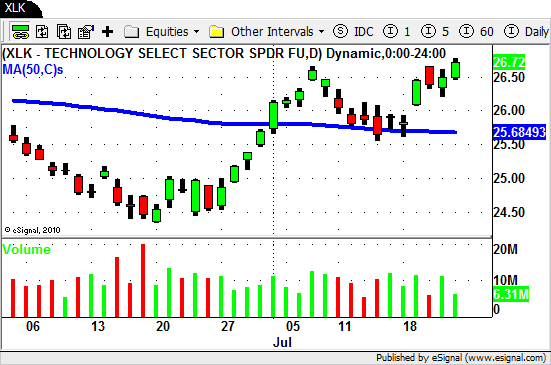
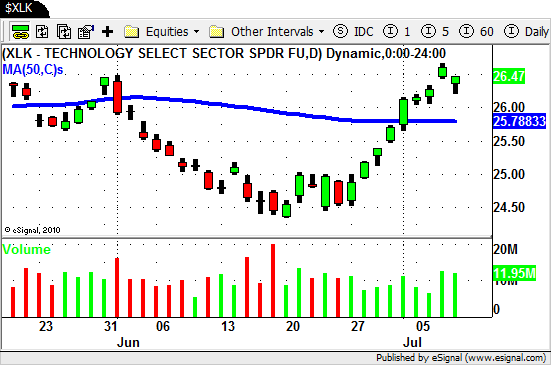
$XLK

$XLK - Technology ETF

$OIH

$OIH - Oil Services ETF

In last weeks BLOG POST we mentioned several individual stocks in these sectors to watch.

The Energy and Oil Service stocks we mentioned all did well.

The Casino stocks moved up but lacked the "pop" (so far) that we were looking for.

The Retail stocks (and ETF) basically "stalled" after moving higher on Tuesday.

$RTH - Retail ETF

The Gold, Gold Miners and Silver ETF's continue to hold up after putting in a nice rally recently.

Keep your eye on the Agriculture ETF's (and stocks) as we move forward since we are seeing some interesting price action and volume patterns lately.

$MOO has drifted up but $DBA is still lagging behind.

The market has moved up fast this week and is flirting with being short term overbought.

Remember though that an overbought (or oversold) market can become even MORE OVERBOUGHT.

Price action and volume paint a picture so look for the clues the market gives you.

Be prepared for anything and as always…Good Trading to YOU!

Swing Trading BLOG – Week in Review – July 8, 2011

Sunday, July 10th, 2011

Swing Trading BLOG – Swing Trading BOOT CAMP

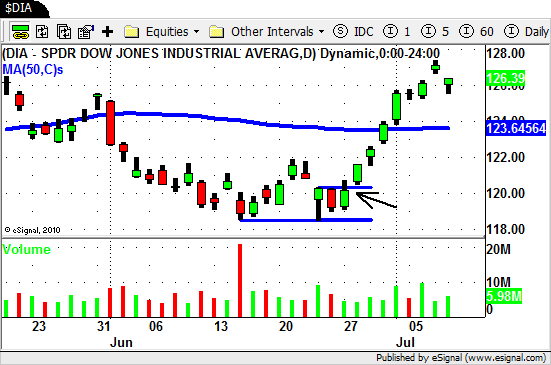
$DIA - Swing Trading ETF

Traders watched as the indices pushed higher this holiday shortened week.

One thing to point out this week is the fact that an oversold or overbought market can still become MORE oversold or overbought.

A lot of Swing Traders were prepared to SHORT this latest rally but when the market moved higher Wednesday and Thursday some were caught in the mix.

Now if you have a tried and true (and tested!) strategy for trading against the market then have at it!

There are a million ways to make money trading so far be it from us to tell you how to trade.

What we are saying though is don't start trading by the seat of your pants using the latest overbought/oversold indicator or oscillator.

There is no doubt that a retrace in the market will happen…it is just a matter of when.

Friday's price action (Gap Down and Reverse) tells us that the BUYERS are still there.

When we open for trading on Monday that could all change but for now don't try to guess what what the market will do.

As we look at the charts for next week we can see that the market is still extended a bit.

There are a ton of good looking charts to watch in the future.

One sector  that stood out this week was Real Estate.

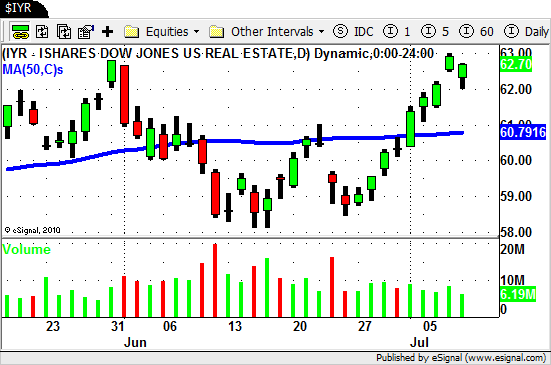
Here is a look at the chart for the Dow Jones Real Estate sector ETF ($IYR).

$IYR - Swing Trading ETF

From a technical analysis perspective $IYR put in a higher low at the end of last month.

As the market rallied recently $IYR has traded up to a NEW HIGH for the year on Thursday.

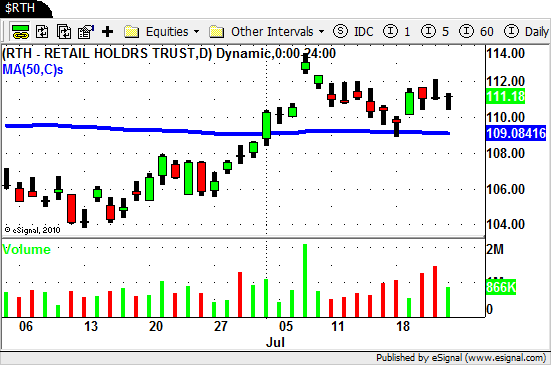
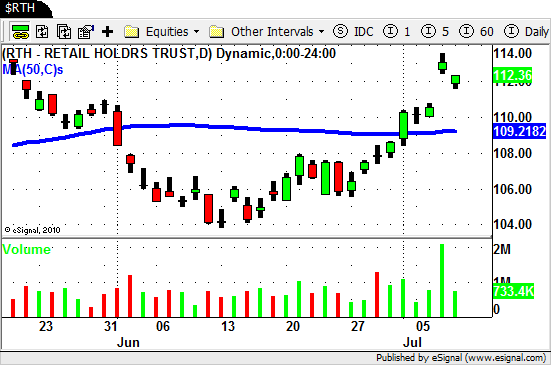
$RTH - Swing Trading ETF

The Retail sector ETF ($RTH) has also rallied nicely as is flirting with NEW HIGHS.

Watch out for the possible overhead resistance in the $114 area first though.

The Technology sector is also on our Watch List as we move forward from here.

Here is a look at $XLK

$XLK - Swing Trading ETF

As far as individual stocks go keep an eye on $AMZN, $ERTS, $JAZZ, $ELN, $LULU and $HAL just to name a few.

Like we said earlier there are a TON of stocks that should be on your list this week.

The volatility is likely to continue so keep that in mind as we head into trading this week.

As always have plan in place for whatever the market decides to do from here.

Until next week…Good Trading to YOU!
Swing Trading Technical Analysis – $MOS – Part 2

Wednesday, May 18th, 2011

Swing Trading Technical Analysis – Swing Trading BOOT CAMP

In this BLOG post we will continue our Technical Analysis view on $MOS.

If your missed part one you can view it HERE.

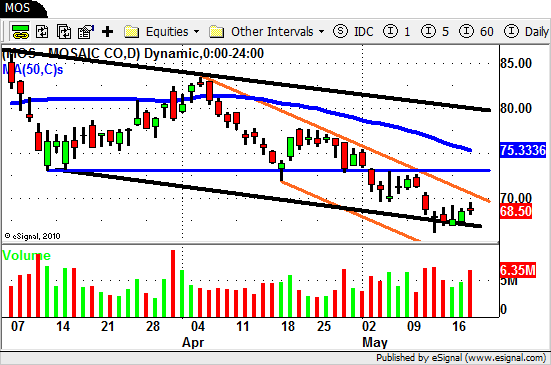
$MOS - Swing Trading Technical Analysis

We when last looked at $MOS it had just created another LOWER HIGH and was "stalling" near an area of potential support ($73).

The thick BLUE horizontal line in the chart above marks this support area.

We also posted that in order for the DOWN TREND to continue we would need to see PRICE move LOWER and VOLUME move HIGHER.

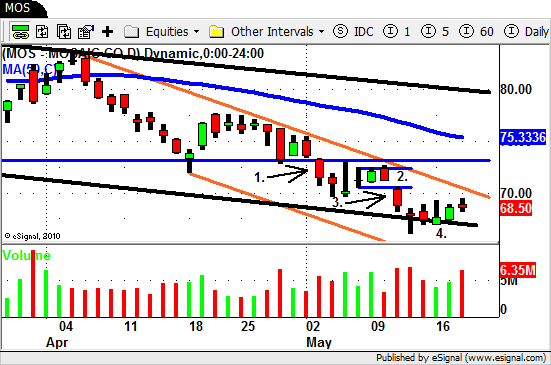
We have zoomed in a bit on the chart and annotated our comments as well.

$MOS - Technical Analysis

Two days after we posted our analysis $MOS did push LOWER ON HIGHER VOLUME confirming that the DOWN TREND was still intact.

We marked this as #1 on the chart.

$MOS quickly lost steam and two days later put in a HIGH VOLUME day but closed very near the low fo the day.

The SELLERS were still there!

$MOS continued to trade "sideways"  (#2.) until May 11th when PRICE again moved LOWER and VOLUME INCREASED (#3.)

This created another leg down in the already established DOWN CHANNEL (orange).

After another day of trading a bit lower $MOS again traded "sideways"  (#4.) until today when we watched $MOS trade above yesterdays high on increased volume.

Now even though $MOS has technically started a retrace it is still in an obvious DOWN TREND.

Notice above how $MOS is still trading inside it SHORTER TERM TREND CHANNEL (thick ORANGE LINES) as well as its LONGER TERM DOWN CHANNEL (thick BLACK LINES).

How and where you could have entered and exited a trade in $MOS depends of course on your time frame and style of trading.

As we move forward from here we apply the same logic and let price action and volume tells where $MOS is headed.

A BREAKOUT of the SHORT TERM TREND CHANNEL would NOT excite us to much at this point since there are now a bunch of resistance levels to contend with.

The LONGER TERM chart of $MOS tells us that $65 has acted a a pretty major area of support in the past.

That being said another move LOWER on HIGHER VOLUME is something we are definitely on the look out for.

If this Swing Trading Technical Analysis walk through was helpful to you please leave a comment below.

© Swing Trading Boot Camp 2024