Posts Tagged ‘Dow Jones Sell Off’

Swing Trading Week in Review – July 2, 2010

Saturday, July 3rd, 2010

In last weeks Swing Trading BLOG post we said that this would be a pivotal week in the market.

Well after the dust settled this week it was VERY CLEAR that the BEARS are in charge!

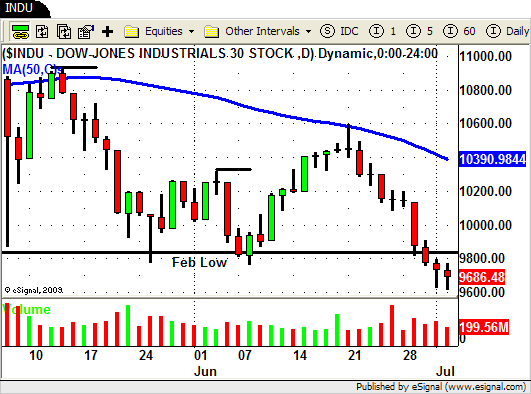
After Monday's "inside day" price action and volume spoke LOUD and CLEAR on Tuesday as the market gapped down and continued to sell off until the week came to close on Friday.
DJIA

The last few weeks have been tough for Swing Traders and this week was no exception.

This week was tough for Swing Traders for a few reasons:

Starting in early June we had nine days where we basically went straight up and now we have had about ten days of trading where the market has gone straight down!

If you are "pullback" trader like we are there has not been many chances over the past month or so for you to implement your trading strategy.

If you did  not have a plan in place and were NOT prepared for Tuesday then you may have "missed the boat" when the market gapped down and sold off for the rest of the week.

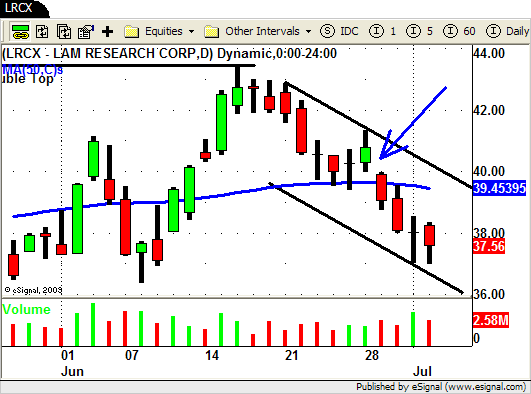
This has been a "fast market" and by that we mean that there ARE chart patterns and pullbacks to trade BUT these pullbacks are shallow, maybe a day or so, and then they continue to move.

This type of price action creates "fast" trend channels and for most traders these are much more difficult to identify and trade.

Lets take a look at some of the stocks we have been following lately to show you what we mean.

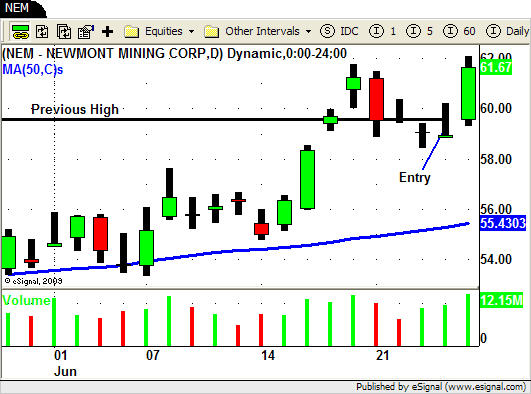
Last week we walked you thorough our entry into Nemont Mining (NEM) on a LONG Swing Trade.

This is the chart from last week.
NEM - Long Swing Trade

As we told you we were able to exit some of our position at $61.67 during last Friday's afternoon rally and we were holding on to the rest with a trailing stop.

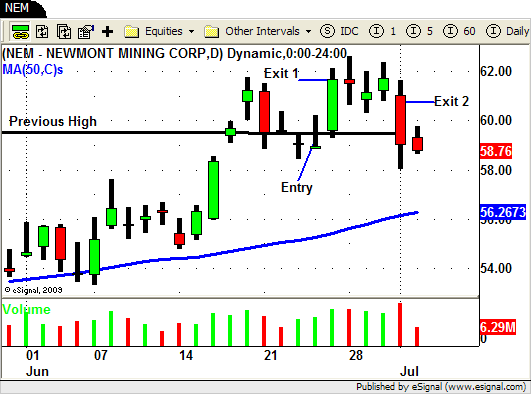
Here is how the chart looks at the end of this week.
NEM - Long Swing Trade

NEM broke out to NEW HIGHS last week so we were expecting some type of follow through to the UP side this week.

Monday NEM stalled and was followed by two days (Tuesday and Wednesday) of slightly UP price movement combined with decreasing volume.

This combination should be a BIG FLASHING YELLOW LIGHT to you just as it is for us.

Our trailing stop was hit at $60.75 on Thursday as NEM traded down through the low of the previous day.

We have marked both of our exits (Exit 1 and Exit 2) on the chart above.

Still a profitable trade but not what we expect from a stock breaking out to new highs.

At pivotal times in the market we often have a few LONG positions and a few SHORT positions and more often than not we get stopped out of the trades that end up being on the wrong side of the market.

One of our losing trades (we had a few) this week was in Sandisk (SNDK).

Here is the chart of SNDK to give you the context…strong stock making higher highs and higher lows.
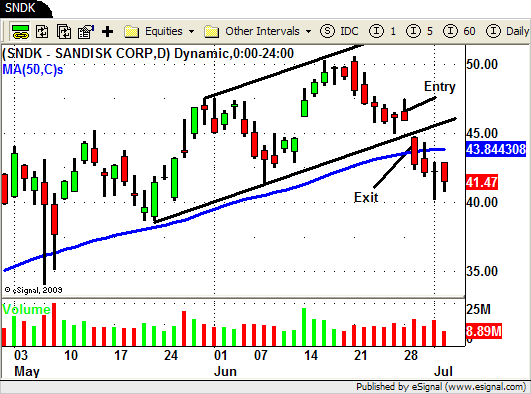
SNDK - Long Swing Trade

During this weeks trading action MONDAY was the make it or break it day in our opinion.

We have been following the recent strength in SNDK so after last weeks pullback we were ready to get LONG again on the first sign of strength.

Monday we got what we were looking for as SNDK traded through Fridays high just as the market also attempted to trade higher.

Our entry was triggered at $47 and our initial stop was set at $44.92 for a $2.08/share risk.

When the market did not follow through on Monday SNDK reversed midday and ended right at the low of the day.

One of the hardest situations that Swing Traders face is what to do when you have a BIG opening gap (up or down) in the market.

Tuesday morning that is exactly what the market did as it opened up the day down significantly from Mondays close.

Like most stocks SNDK was no exception and gapped down with market and opened at $44.76 which was BELOW our initial stop.

Our exit strategy when this happens is dependent on the context of the overall picture that the market, sector and individual stock is painting.

in this specific example the strategy calls for an exit on the open for a number of reasons.

Our actual exit price was $44.74 so we actually lost  $2.26/shareMORE than initially planned.

Here is a zoomed in version so you can see the details a bit better.
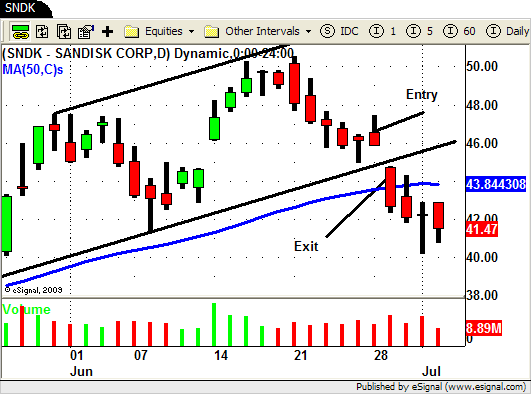
SNDK - Long Swing Trade

This losing trade in SNDK shows you why having a position sizing and money management strategy in place is so important.

Due to the frequent overnight gaps we face as swing traders we recommend that you have a "buffer" built in to your position sizing strategy to allow for a "worst case" scenario.

When strong stocks like ALK, NTAP, SNDK and MELI start to break down at pivotal times that usually means our SHORT positions (weak stocks or ETF's) are continuing to sell off.

The "weak" Retail (RTH) ETF continued its sell off this week but you almost had to be in this position coming into the week.

The other noticeably weak sector, the Homebuilders (XHB), offered you yet another opportunity to get SHORT as it broke to NEW LOWS on Tuesday's "gap and go".

Other SHORT trades that worked out nicely were LPNT, ERTS, X, and MGM.

I mentioned above about this being a "fast" market and here are a few example of stocks with "fast channels" to demonstrate my point.
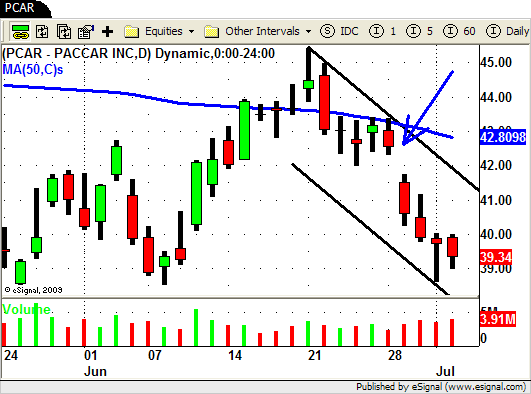
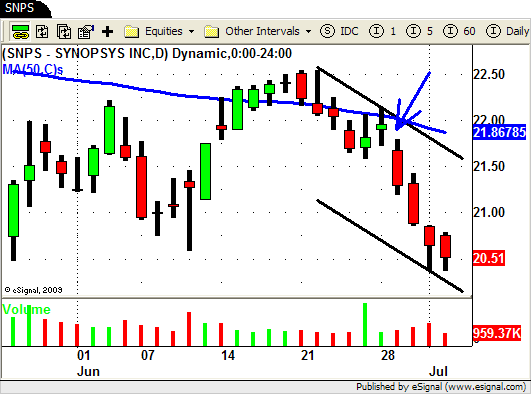
PCAR - Fast Trend Channel SNPS - Fast Trend Channel LRCX - Fast Price Channel

In all of the charts above you can see that after pulling back from their recent highs all of them attempt to move higher on Monday.

They all fail to move higher the next day essentially creating a one day UP move before continuing to sell off.

If they all would have moved higher for another day or so the chart pattern would have painted a more clear picture for those traders not yet skilled at identifying this type of "fast" trend change.

Probably the best example of just how 'fast" this market has been is to look at the overall market ETF's for the DJIA (DIA) and the S&P 500 (SPY).
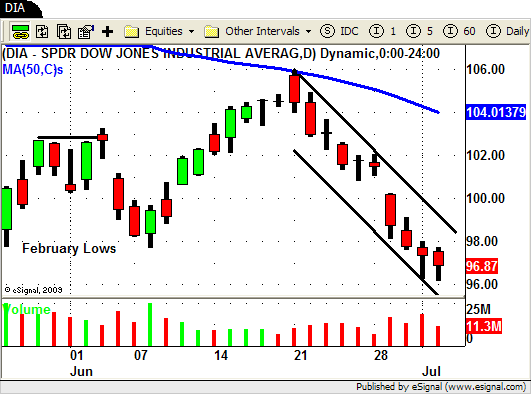
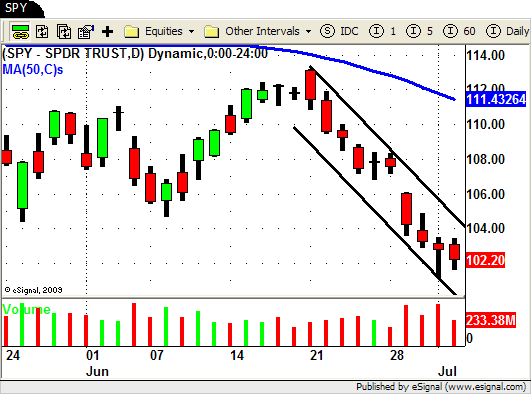
DIA - Swing Tading ETF SPY - Swing Trading ETF

You can see how the market sold off everyday last week as it put in its first pullback after the 9 day up move.

Monday you can see how price "stalls" and creates an inside bar.

Tuesday the market "gaps down" and sells off for the rest of the week not giving swing traders much of a pullback to SHORT.

In order to capitalize on this type of "fast" price action you need to learn how trends transition and use price action and volume as your leading indicators.

These are the exact strategies we teach in our PVT Trading Tactics class so if you would like to learn more you can check it out HERE.

Until next week…Good Trading to YOU!


Swing Trading Week in Review – May 21, 2010

Friday, May 21st, 2010

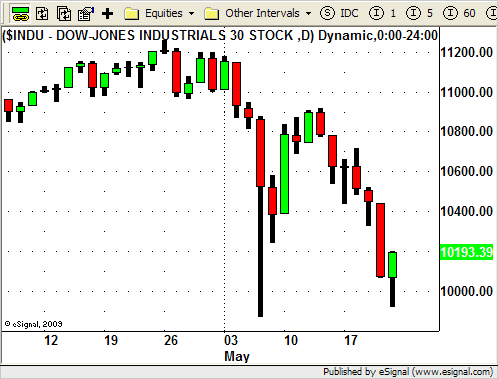
The SELL OFF continues!

Another volatile week in the markets this week as the sellers came out in droves driving the Dow back down near the lows we saw on May 6.

DJIA - Swing Trading Strategies

In last weeks Swing Trading Blog post we notified you of the numerous SHORT Swing Trade setups we had on our "Watch List" for Thursday (May 13th) morning.

Our strategy was to locate weak sectors and individual stocks within those sectors that were giving us LOW RISK setups.

We also advised that when the market followed through to the downside we entered into several new positions.

In our Swing Trading Newsletter we highlighted the Semiconductor ETF (SMH) and several of the stocks (KLAC. LLTC, MXIM) within that sector that had nice SHORT trade chart patterns.

Some of the other stocks on our list included AXP, FDX, MET, ALL, and SOHU.

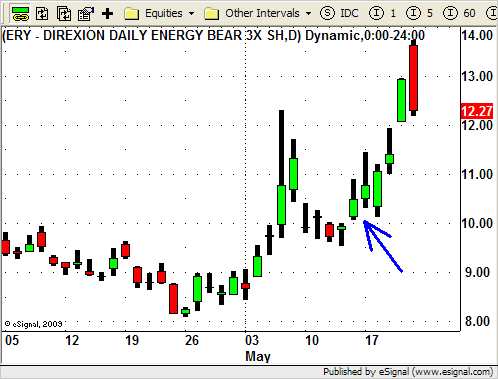
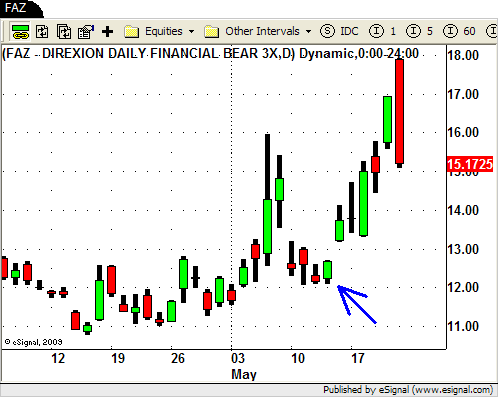
We also got LONG trades off in the Inverse Energy ETF (ERY) and the Financial Inverse ETF (FAZ).

ERY - Inverse Energy ETF Swing Trading

FAZ - Inverse Financial ETF Swing Trading

Well needless to say these trades played out nicely this week as the market made its way lower.

We were able to scale out of our trades on the way up and when the market gapped down again on Friday we tighted our trailing stops and were taken out of most of our remaining shares.

The sellers were relentless this week taking down almost every sector along with it.

The Steel (SLX), Solar(TAN), Oil (OIH), Energy (XLE) and Agribusiness (DBA) ETF's all made new yearly LOWS this week.

Some of the previously strong sectors also came down with the market during this weeks sell off.

Retail (RTH), Real Estate (IYR) and the Homebuilders (XHB) finally broke under their 50 day SMA's and headed lower.

The Gold (GLD and GDX) and Silver (SLV) ETF's came off of their recent highs to put in a lengthy and somewhat concerning pullback.

Fridays "bounce back" tells us that a retrace could be in order going into next week.

We are currently watching some stocks that have shown signs of relative strength during the down move this week but until the obvious negative sentiment changes we will continue to look for additional SHORT trading opportunities.

If you would like to learn more about our Swing Trading Strategies and Techniques please feel free to join us at any one of our upcoming courses or webinars.

Until next week…GOOD TRADING TO YOU!


Swing Trading Week in Review – May 7, 2010

Friday, May 7th, 2010

Can you say Volatility?

Wow!

What a roller coaster ride we had in the market this week!

After the dust settled we ended the week with the NASDAQ down 8%, the S&P down 6% and the DOW down 5.7%.

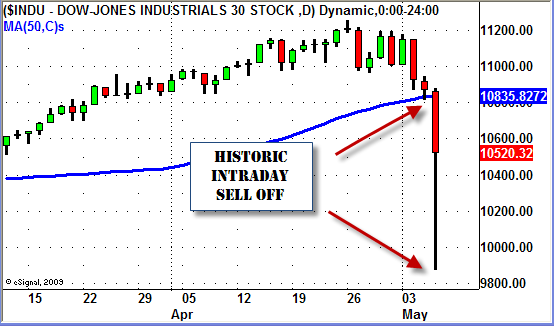
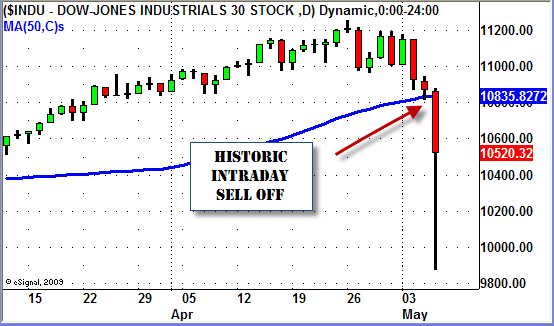
This highlight of the week was of course the historic intraday sell off in the markets on Thursday.

The DOW fell almost 1,000 points (due to a trading error?) in the early afternoon but staged a comeback and the late day rally brought the market up to finish the day down only 347 points!

DOW JONES SELL OFF - May 6, 2010

Wow…what a crazy day indeed!

Last week we advised our Swing Trading newsletter subscribers to go into this week on "High Alert".

This alert was due to the market putting in its first significant LOWER HIGH since the rally started in February.

He is a a similar chart that we posted with our "alert".

Dow Jones Lower High April 30, 2010

The S&P and NASDAQ 100 charts had the same chart pattern which was a "triple heads up".

When the market opened up on Monday and rallied right out of the gate finishing just off the highs a lot of traders thought Fridays price action had to be a "fake out".

For us though Tuesday's price AND volume action kept us looking more to the SHORT side for Swing Trading opportunities.

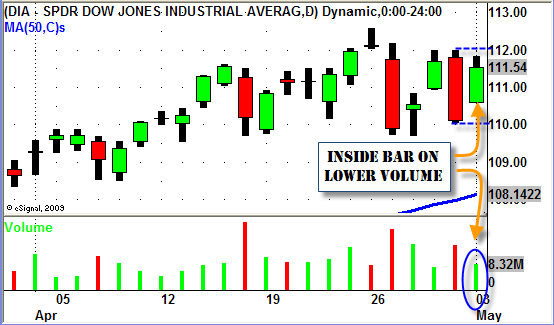
When we have a strong move (like the DOWN move on Friday) followed by a LOW VOLUME "inside day" it is only an indication that price is "stalling".

DOW JONES SWING TRADING INSIDE BAR

When price "stalls" we simply wait for the market to tell us what it will do next.

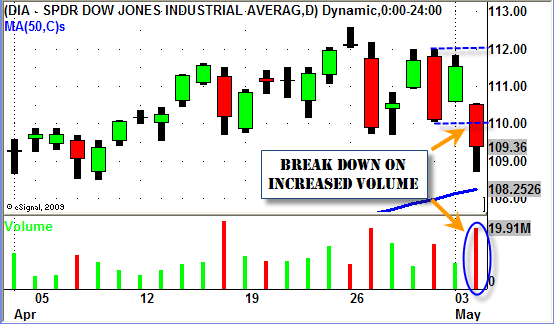
Then on Wednesday the market spoke LOUD and CLEAR and confirmed that the dominant direction was to the DOWN side by gapping down and selling off on INCREASING VOLUME.

DOW JONES - Inside Bar Continuation Pattern

Going into Wednesday there were several stocks and ETF's that had nice SHORT Swing Trading setups.

Or for those of you who don't feel comfortable SHORTING yet we recommend you focus on the Inverse ETF's.

DXD, SKF, FAZ, and DUG (just to name a few) all had nice LONG setups since they are Inverse ETF's.

If you were SHORT (or LONG the Inverse ETF's) going into Thursday everything was good to go until the excitement started in the afternoon.

Then things got a little tricky.

If you use intraday data in your swing trading the extreme volatility Thursday afternoon gave you a chance to lock in some nice profits.

If you are able to only use end of day data then the situation was obviously a little different for you.

We use intraday data so we did a complete post on how we handled yesterday's extreme volatility HERE.

We exited most of our positions yesterday as our trailing stops were hit when the market rebounded after the massive sell off.

If you werent prepared or didnt have a plan then you probably gave back  some profits.

We had no problem being almost flat even if the market would have continued significantly lower today. (the DOW was down today but still higher than the LOW of yesterday).

We followed our trading plan and exited our positions when our rules told us to.

Today (Friday) was simply a day for us to watch the market to see how things would finish for the week.

We aren't looking to chase this market down at this point.

We will sit on the sidelines and patiently wait for our next LOW RISK/HIGH REWARD trade setups to present themselves.

A few sector ETF's we will keep a close eye on as we move forward are the SILVER (SLV), GOLD (GLD) and the GOLD MINERS (GDX) ETF's.

After such a crazy week in the market don't get over anxious and start trading just to trade.

It can be tough when the market is moving the way it did this week.

It creates "excitement" and sometimes you may feel like you are "missing the boat".

BE PATIENT!

There will be plenty of opportunity in the very near future for you to get back into the market no matter which way it goes from here.

Until next week…

BE PATIENT, PROTECT YOUR CAPITAL and GOOD TRADING TO YOU!


As a Swing Trader, how did you handle today’s historic sell off?

Thursday, May 6th, 2010

How did you handle the historic sell off in the market today?

Today the Dow Jones Industrial Average dropped nearly 1,000 points before rallying back by the end of the day to finish down a mere 347.80 points.

Dow Jones Sell Off May 6, 2010

News is coming out now about a "trading mistake" made by a "large trading firm" being the culprit for the sell off.

More importantly though is how you, as a swing trader, handled today's extreme volatility.

If you were LONG any positions did you follow your trading plan and EXIT when price hit your STOP (Initial or trailing) level?

If you were SHORT did you follow your plan and COVER when price hit your profit target?

Did you see the sell off and just "hold on" and hope for the best?

Or did you hang on for the entire down move only to see some quick profits evaporate because everything happened so fast?

And on top of that, since you held most or all of your position, you are worried about what the market will do tomorrow since this sell off may have been an "error".

If the last 3 sentences describe how you handled today's market and your current  situation then I would venture to say that you probably don't have a trading plan in place.

And if you do have a "plan" then you either did not follow your rules OR your trading plan needs updating and/or more specific rules.

Now if you have a longer term outlook than the average Swing Trader (2-5 days) then this may NOT apply to you.

On the other hand if you are a short term trader than today's continuation move down gave you ample opportunity to take your profits and even trail the rest (if your strategy calls for scaling out of a position).

Let me give you an example using a trade we initiated last week.

After one successful trade early in the week we alerted our newsletter subscribers last Friday of another LONG trade setup in the Inverse Financial ETF (FAZ).

We have been watching this sector closely since the negative news about Goldman Sachs (GS) came out.

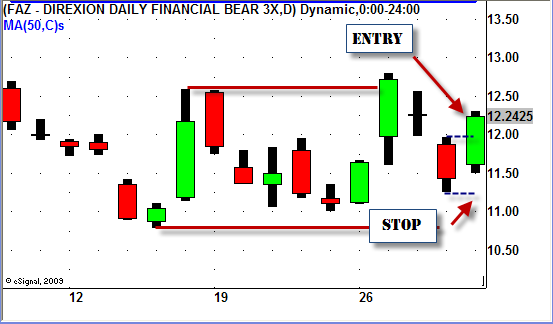
After entering into the trade at $12.01 we set our initial STOP LOSS level at $11.23 which is just over 1 ATR from our entry.

FAZ - Swing Trading ETF

Our initial PROFIT TARGET was set to $13.57, 2 ATR's, above our entry price.

As of this morning we were still in our trade so lets describe how the day played out.

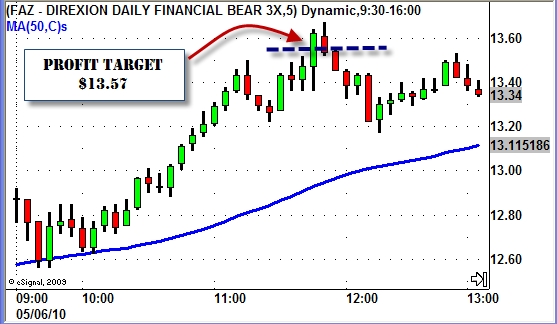
Just before noon today FAZ hit our profit target at $13.57.

FAZ - Swing Trading ETF

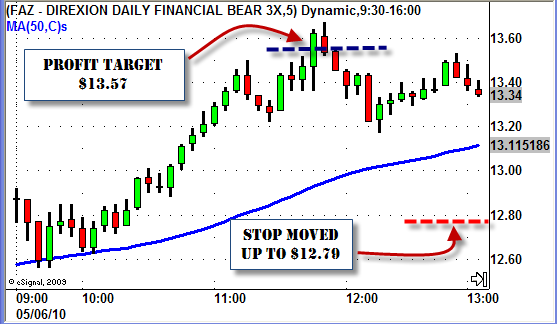
For this specific strategy our plan was to sell half of our position at the PROFIT TARGET and use a trailing stop, set to 1 ATR below the current price, for the remainder of our shares.

We followed our plan and exited half of our position at $13.57 and moved our STOP up to $12.79 (13.57 minus .78 which is 1 ATR).

FAZ - Inverse ETF

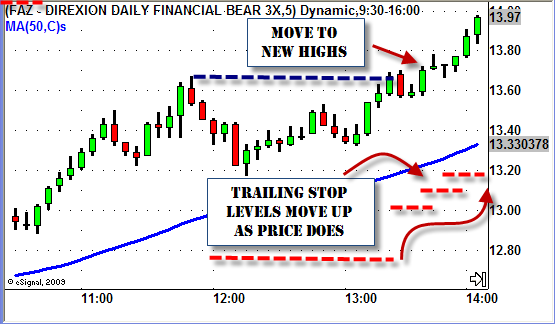
After consolidating for over an hour FAZ started to take off at started to make new highs around 1:45pm.

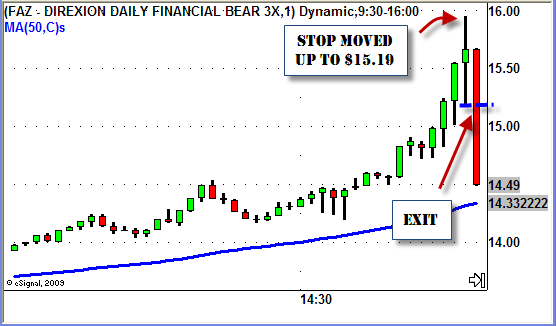
As FAZ continued to rally all the way up to $15.97 we held tight and followed our plan by moving our trailing stop UP as price increased.

FAZ - Swing Trading ETF

We trailed our stop by 1 ATR all the way up and ultimately set our final stop at $15.19 (15.97 – .78).

When the market started to bounce and FAZ turned south it happened FAST.

Here is a look at the 1 minute chart so you can see the move.

FAZ - Swing Trading ETF

FAZ fell almost $1.50 in ONE MINUTE!

FAZ eventually came all the way back down to $13.93, more than $2 off the days high!

That is a lot of profit to give back.

Had we not quickly implemented the plan we had in place we would have given back a large portion of our profits very quickly.

If you are serious about trading (and your money) create a detailed trading plan that specifically lays out what you will do in each and every situation the market throws at you.

Having a set of rules in place (and following them) not only leads to less stressful trading but can also help you hold onto some of your hard earned profits!


© Swing Trading Boot Camp 2024