Archive for the ‘Swing Trading Chart Patterns’ Category

Swing Trading Update – The Retrace – 1.29.16

Sunday, January 31st, 2016

Well for Swing Traders this was the week of the "retrace". Monday we saw the markets drift lower all day but the volume didnt really kick in. Swing Trading Strategies - 1.29.16

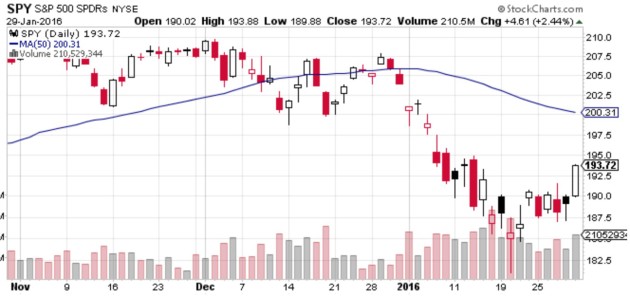
Tuesday and Wednesday gave traders a big clue as we watched the market basically fight to find a direction.

On Tuesday the clue was an "up" day on increased volume compared to Mondays "down" day on light volume.

Wednesday we had an "outside" day on even bigger volume with a close on the low end of the trading range for the day.

Thursdays light volume "inside" day let you know that the market was taking a "pause" and would more than likely (nothing is for certain) continue is retrace to the upside soon.

Friday we watched as the market did just that. The $SPY had some nice volume to the upside while the $DIAs volume lagged a bit.

Both charts however showed a good combination of price and volume to at least let you know what side of the market (the long side) was the right side to be on.

As we look through the charts of the sector ETFs we see a few good trade setups assuming of course that you are a counter trend trader.

A long trade in $XLE set up nicely as it did in $IYF and even $XLK for those brave traders.

A note on the GOLD ETF's here…

$GOLD ripped to the highs this week with $GDX and $NUGT looking better as well. $ABX is shaping up and maybe taking a look at Silver $SLX would be wise.

As we look forward to trading tomorrow just remember that we are trading under the 50 day SMA AND that we are in a down channel.

With that being said there is a lot of white space on the charts to the upside if the buyers want to push us back a little closer that 50 day "trendline".

If you are a short term swing trader then look to adjust your risk/reward on these counter trend trades so that the math still works for you.

I personally dont think the we are anywhere near done on the short side but time will tell. In the meantime we will continue listen to what the market tells us and trade appropriately.

We hope you do the same. Until next week…Good trading to YOU!

Intraday Swing Trading [Video] – Price Action and Volume

Wednesday, January 9th, 2013

Our Intraday swing trading strategies using price action and volume for the end of day trades for January 9, 2013.

When day trading stocks and ETFs we always watch what the overall market is doing and use that as a guide for our trades.

In this video I show you how the DJIA ($DIA) was attempting to trade lower in the last half hour of trading.

$BA was showing signs of relative strength and gave us a nice chart pattern to trade into the close.


Swing Trading Blog – Week in Review – January 6, 2013

Sunday, January 6th, 2013

Swing Trading BLOG – Swing Trading BOOT CAMP

Well 2013 started with a BANG now didn't it?

Swing Trading Strategies and Tactics

This holiday shortened week started out with a rally on BIG VOLUME on Monday.

The price action we saw created a bullish engulfing bar on the charts. This type of chart pattern was a sign for the shorts to cover as the longs pilled in!

Once the news of the fiscal cliff deal came out the marked GAPPED UP in a big way on Wednesday after being closed Tuesday.

This GAP UP left a lot of traders scratching there heads on where they could enter into the move.

As a SHORT TERM trader the day to get long was on Monday…not on Wednesday.

The move that happened Wednesday classifies as a continuation move for us.

We were looking to SELL our SHORT TERM trades towards the end of the week…not enter into new positions.

As you look through the charts you will see nearly the same chart pattern on each one of them.

The sector ETF's look the same although some were better candidates then others.

The Financials ($XLF $IYF) and Homebuilders ($XHB) had some nice setups.

The Steel ETF ($SLX) also had a nice pattern to trade if you caught it in time.

As far as individual stocks go there are too many to list. Lets just say that there were tons of good looking charts out there to trade. ($GOOG, $NSC, $GS, $MA, $V, etc)

Swing Trading Strategies and Tactics

Next week will be the true test to see how real this rally is.

Keep you eyes on stocks that start to pullback to see how the hold up in relation to the overall market.

If the rally continues there will be plenty of time for more good trades.

There is no need to chase the market up.

As always have a plan and prepare for whatever the market throws your way.

Until next week…Good Trading to YOU!

Intraday Swing Trading Strategies – The “3Down” Chart Pattern

Thursday, December 13th, 2012

Intraday Swing Trading Strategies – The "3Down" Chart Pattern

This morning we were on the watch (as always) for one of our favorite chart patterns…the "3Down".

We had a few stocks on our list this morning but one stock that stood out like a sore thumb was $MON.

$MON was showing unusual relative strength this morning as the overall market tried to find its way.

Both the DJIA and S&P both sold off early and hit NEW LOWS on the third 5 minute bar of trading today.

Here is the chart of $DIA…

$DIA - Intraday Swing Trading Strategies

And now take a look at $MON for comparison…

$MON - Intraday Swing Trading

The strength is obvious.

So now that we know we have a strong stock in a relatively weak market what do we do?

We watch and wait.

As the $DIA finds a bottom and start to retrace $MON starts to pullback.

We know at this point that the chances are high that the strength in $MON will not continue if the market starts to push lower again.

If however the overall market transitions from weak to strong then $MON could make its next move higher.

The 10:15am bar is where all the action took place for this trade.

Here is the setup and the countdown chart for the "3Down"…

$MON - Intraday Swing Trading

Notice the first attempt to begin our countdown on the chart above.

The bar before the "XX" on the chart is the first "1" bar.

The next bars high is higher than the previous bar so we start over.

The bar after the "XX" starts our new count over at "1" since its higher is lower and its low is also lower than the previous bar.

The next 2 bars do exactly the same thing giving us our "3Down" setup!

Notice also how bar "3" has lower volume than bar "2". This means the selling is drying up.

Now that we have a valid "setup" we wait to see if we get an entry signal.

The 10:15am bar (marked with the BLUE arrow) provides us with a text book entry.

The volume starts pouring into this bar early so we can figure the price action will move one way or the other.

This bars low never trades below the low of the previous bar…bullish!

This bar trades above the high of the previous bar…bullish!

As the bar develops BUYING volume increases…bullish!

We are in the trade at $90.27 (.02 above the previous bars high) and we set our stop at $90.12 (.01 below the previous bars low) for an initial risk of .15/share.

Our STS profit target is at 2x the initial risk (2 x .15 = .30) so we set it at $90.57 ( $90.27 + .30 = $90.57).

Three bars after our entry $MON hits $90.57 (trades up to $90.61) and hits our target before beginning another pullback.

© Swing Trading Boot Camp 2024