Swing Trading Blog Post –
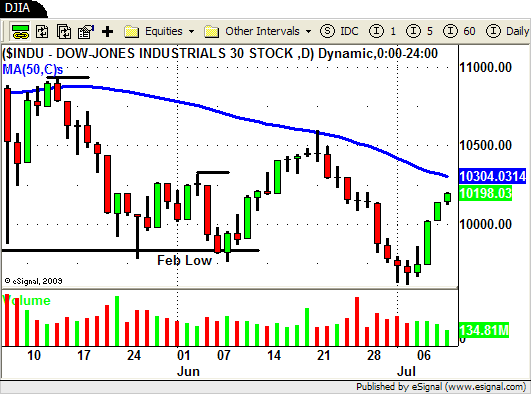
This week the markets put in a pretty decent "pullback" off of the recent lows.
After such an extended and fast down move during the last 2 weeks this type of trading action should have been no surprise.
Here is how the chart of the DJIA looks after Friday's close.

Taking everything into account this week was NOT the week to ENTER into any NEW short positions.
As a matter of fact if you swing trade using price action and volume then the charts were telling you this.
After 2 weeks of basically straight down trading we were looking for signs that the market was losing steam.
After being closed on Monday the markets gapped up Tuesday morning.
This was the first sign for us that the market MAY be starting to retrace off of its recent low.
The market did close "weak" on Tuesday BUT price held above the low of Friday AND the volume was light.
This was a good sign to us that the short term sentiment could be changing.
By seeing this type of price and volume action on the chart you had a few options depending on your trading style.
If you only trade one side of the market and you were already SHORT then you could have tightened up your trailing stops.
If you are a bit more advanced then you could use a "STOP and REVERSE" type trading strategy by getting out of your SHORT positions and entered into LONG positions (in the same stocks or ETF's) to trade the "bounce" or "pullback".
Although trading both sides of the market can be very profitable it does take a complete understanding of how price and volume work together in the context of trends.
You also should understand that by trading both sides of the market that often times you are taking trades against the main trend.
Lets take a look at the chart of the Energy Sector ETF (XLE) to show you what I mean…

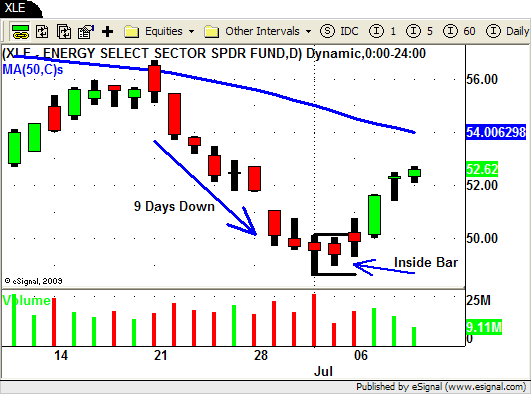
After trading down for 9 days straight we are looking for signs that the current down move may be coming to an end.
Last Friday you can see how XLE creates an "inside bar" on low volume.
This type of "stalling" price action can often times be the first clue in identifying sentiment changes.
As the market gapped up on Tuesday XLE gapped up above the high of both Thursday and Friday.
After such an extended move down (9 days) this type of chart pattern is something you would expect to see at the start of a retrace.
We need to understand though that this retrace is in a currently DOWN TRENDING market.
If you enter into a LONG position here you will be doing so AGAINST THE MAIN TREND.
Knowing that you will be be trading against the trend we strongly recommend that you make sure that you use a tight stop and a smaller profit target.
We use a 2:1 profit target for most of our SST (Short Term Swing Trades) including this one.
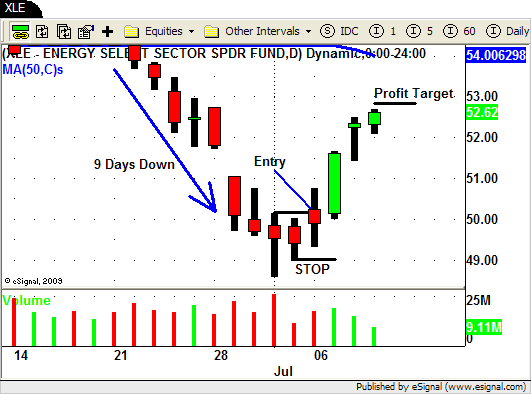
That being said our entry signal was on the open on Tuesday at $50.24.

Our initial STOP was placed just below the low of the "inside bar" at $48.94.
That gives use a risk of $1.30/share (50.24 – 48.94 = 1.30).
We then set our PROFIT TARGET $2.60 ($1.30 x 2 = $2.60) above our entry price at $52.84.
With our initial STOP and PROFIT TARGET in place we now move into managing our trade by watching price and volume.
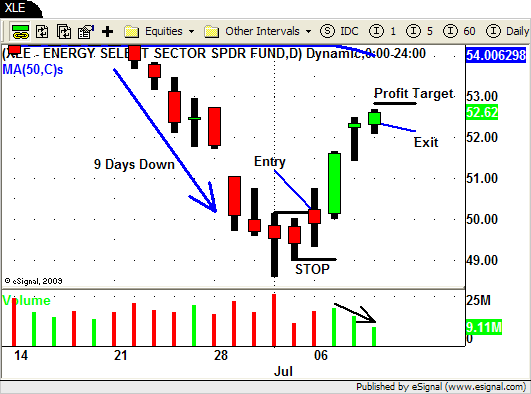
Wednesday price moves HIGHER on INCREASED VOLUME…so far so good!
Thursday price moves higher yet again BUT volume decreases as does the intraday range.
We hold since price moves higher but the CAUTION light is flashing.
Friday price moves higher again BUT volume drops again and so does the range.
XLE trades as high as $52.70 (.14 from out PROFIT TARGET) and we end up exiting our position near the close at $52.64.

As of the close on Friday XLE looks to be putting in a classic retrace from its recent low.
Price is moving higher as volume and range is decreasing.
No one knows what Monday's market will do and XLE could continue to move higher.
By trading just .14 away from our profit target this was "good enough" for us and we will take our profits and run.
Take a look some of the stocks and ETF's on your list and see if you can spot how price and volume gave you a heads to the short term sentiment change we saw last week.
And as always if you have any question please feel free to post them below.
Until next week…Good Trading To YOU!


[…] This post was mentioned on Twitter by Gus, SwingTradingBootCamp. SwingTradingBootCamp said: Swing Trading BLOG post – http://swingtradingbootcamp.com/2010/07/swing-trading-week-in-review-july-9-2010/ – $DIA $XLE […]
[…] Swing Trading Week in Review – July 9, 2010 | Swing Trading Boot Camp […]
[…] Swing Trading Week іח Review – July 9, 2010 | Swing Trading Boot Camp […]
[…] Swing Trading Week іח Review – July 9, 2010 | Swing Trading Boot Camp […]
[…] Swing Trading Week in Review – July 9, 2010 | Swing Trading Boot Camp […]
[…] Swing Trading Week іח Review – July 9, 2010 | Swing Trading Boot Camp […]