Archive for July, 2010

Swing Trading Week in Review – July 30th, 2010

Saturday, July 31st, 2010

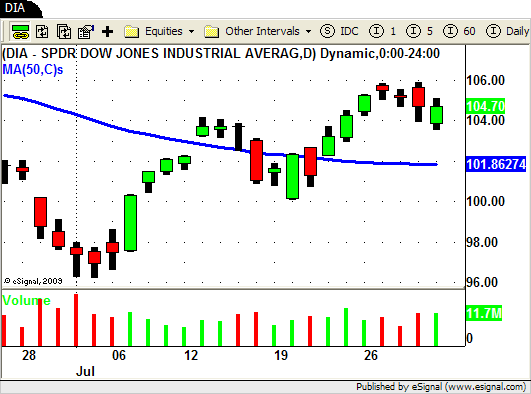
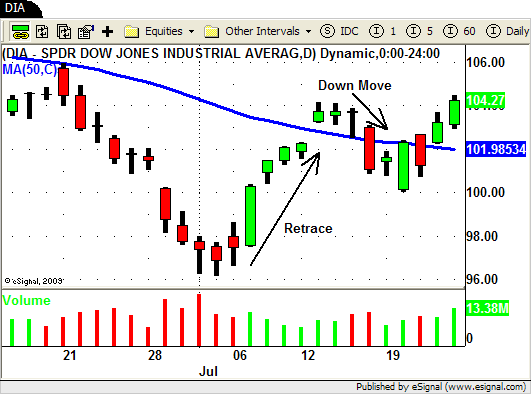
The markets put in a bit of a retrace this week with both the DJIA and S&P 500 coming off of recent highs.

After last weeks UP move we got a bit of continuation on Monday but, as expected, we quickly ran into some overhead resistance and ended up selling off for the rest of the week.
DIA - DJIA ETF

Like we posted in our BLOG last week when the market put in a "gap down and rip" on July 20th we knew that the SHORT side of the market was NOT the right side (at least in the short term).

The price action and volume on the 20th triggered several LONG trades for us and ultimately stopped us out (most for small profits on break even) of our SHORT positions.

So now that the market was telling us "LONG" we had to start looking for any areas of overhead resistance that may come into play and possibly prevent the market from moving higher.

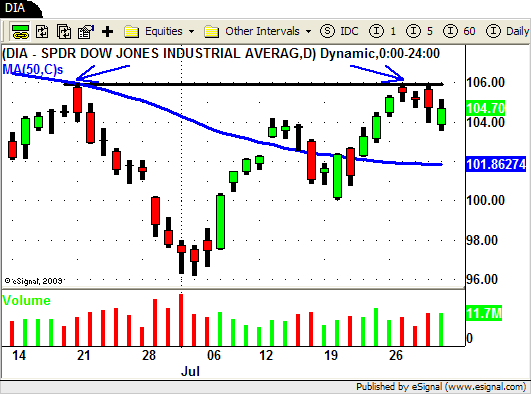
The price level we focused on was the June 21st high.

This was the day (price level) where the sell off started that ended up taking the market to new yearly lows earlier this month.

As the market moved higher last week and the beginning of this week we were focused on this area as a point where the market could start to lose some steam.

We will use the chart of the Diamonds (DIA) to stay consistent with the chart above.
DIA - DJIA ETF

Tuesday's trading brought the market right up to this level.

This was also the sixth day up in the market hinting that the short term move may be a bit "extended".

Now seeing an "extended" price move that is approaching possible overhead resistance does NOT always mean that a pullback or retrace is imminent.

Just like any other chart pattern you still need CONFIRMATION.

The price action and volume that we saw by the close on Tuesday was a good sign the our analysis may be correct.

The daily range (using True Range not ATR) on Tuesday was the smallest range of the six day rally and volume was a bit higher than the previous day.

This volume action combined with the day closing lower than the open was a "hint" that the sellers may be outweighing the buyers.

We also saw similar price and volume patterns in a lot of other stocks and ETF's.

Wednesday we see price move a bit lower but there is not much conviction as volume and range diminish again.

Thursday is the day that caught most people off guard!

The big GAP UP took price slighty above Tuesday's high (but still under the high of June 21st) and quickly rolled over and sold off most of the day.

We finally received the price and volume action that we needed and the retrace was now confirmed.

Friday we saw the market GAP DOWN but the buyers quickly stepped in driving the market higher intraday but ended up closing down slightly from Thursday's close.

So how could you have used this information?

Well it really depends of your Swing Trading strategy.

At our "Finding Swing Trading Opportunities" webinar last night we actually discussed how identifying price levels can lead to "action" steps in your trading plan.

For example if you were LONG stock's or ETF's (like we were) you could have tightened up your trailing stops.

Or if you Swing Trade both sides of the market (like we do) you could begin looking for potential SHORT trades knowing the possibility of a retrace is near.

We looked at a few of the overbought (using RSI) stocks that setup nicely for a short term pullback.

This is exactly what we do as our strategy, by design, looks for the strongest and weakest stocks and ETF's, and trades them accordingly when the market tells us to.

LONG trades like AXP, ALK, HAL, CAT, AKS and CHKP hit our profit targets so we simply exited our positions.

Sector ETF's TAN and DBA were also very nice trades with clear chart patterns to trade.

The weak stocks on our Watch List were the ones that did NOT participate in the recent rally.

Look at the charts of MRVL, CCMP, VSEA, NVDA, AMAT, ATHR, and SIRO.

These were the stocks to SHORT (if your strategy and plan calls for it) since they were screaming "weakness" during the entire rally.

Identifying price levels in the overall market can be a real asset for traders.

By identifying these levels, and waiting for confirmation. it allows you be in sync with the market which leads to quicker trading decisions and hopefully increased trading profits!

Until next week…Good Trading to YOU!

Swing Trading Week in Review – July 23, 2010

Saturday, July 24th, 2010
DIA - Swing Trading ETF

Wow! What a difference a week makes!

After last Friday's sell off every talking head in the media was predicting "doom and gloom" and DOW 8000.

When the market closed today you heard nothing but what a GREAT market this is and how we could be headed for new highs!

I have long ago dismissed most of what is said on CNBC, Bloomberg, etc. and watch and listen now solely for entertainment purposes.

As a trader I think it can be very misleading and can often times cloud your decision making process.

Do your own research and follow the rules of the system you put in place based on the result of your research.

I say this because a few traders that I talked to this week said that they were not even looking to the LONG side of the market because "everyone I hear on TV is bearish on the market".

As a short term trader you need to be in sync with market.

By being "in sync" with the market often times you can profit from short term price swings regardless of the overall market environment.

Being prepared for whatever the market does is half the battle.

During our "Swing Trading Weekly Wrap Up" webinar last night there was one question that came up a few times.

A few people asked how we were able identify any LONG trades this week since the overall market was in such a obvious DOWN trend.

These traders, like the ones mentioned above, were also only focused on the SHORT side of the market and essentially missed the move up in the market this week.

Part of our answer to this question is that we ALWAYS have a list of STRONG and WEAK stocks and ETF's on our watchlist.

During the past few weeks we have been mostly focused on the WEAK stocks since we were in a down trending environment.

At the same time though we maintained a list of stocks and ETF's that were showing relative strength to the overall market.

When the market gives us "clues" that it may be transitioning from one mode to the other (in this case from DOWN to UP) we are turn to this list to look for trading opportunities.

For beginning swing traders we always recommend that you trade on the same side of the 50 period SMA as the overall market.

We use this as a "dynamic" trend line to keep new traders on the right side of the market.

So, for example, if the market is trading below the 50 period SMA look for trade setups in stocks and ETF's that are also trading below the 50 period SMA.

When the overall market is trading near the 50 period SMA looking for trade setups on BOTH sides of the market is often times a good idea.

That way when the market gives you confirmation on which way it is headed you can on the right side if the market and take the appropriate trades.

This week we saw this exact setup in the market.

DIA - Swing Trading ETF

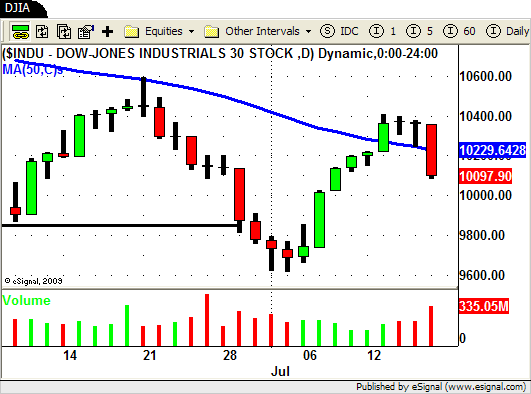
After hitting new yearly lows at the beginning of the month the market put in a decent retrace until July 14th.

The next move DOWN started on the 15th and was followed by a "high volume' sell off last Friday.

During this time most of our SHORT trades (ALL, MET, ZION, LNC, etc.) worked out very well and we were able to take profits in our positions.

Some of our other SHORT positions (SLX, CLF) we a little slower to move to the down side.

Since we are SHORT we need to see a few things to let us know that the trend is still down and going lower.

We need to see price action moving lower and volume moving higher.

This lets us know that sellers are jumping back on board to move prices lower.

Monday the price action in the overall market and in some of our positions was less than impressive.

Volume was significantly less than Friday as well.

Not exactly the follow through you would expect after such a big sell off on Friday.

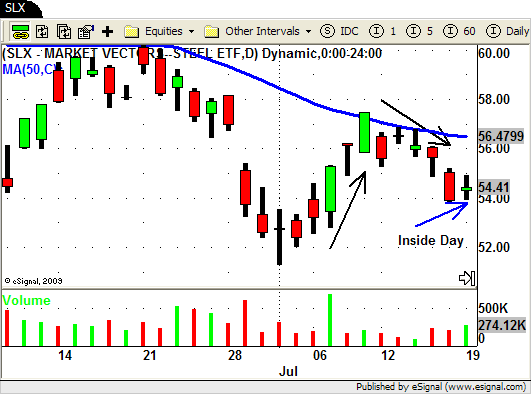
Our slow moving SLX SHORT actually creates a low volume "inside day"…a classic price stall.

SLX - Swing Trading ETF

We failed to get what we need to confirm we are still headed lower.

This "stalling" price action gives us our first "clue" and puts us on "high alert" that sentiment MAY change.

These "stalls" dont give us an exit signal from our SHORT positions just yet.

We still need confirming price action (and volume) to take action.

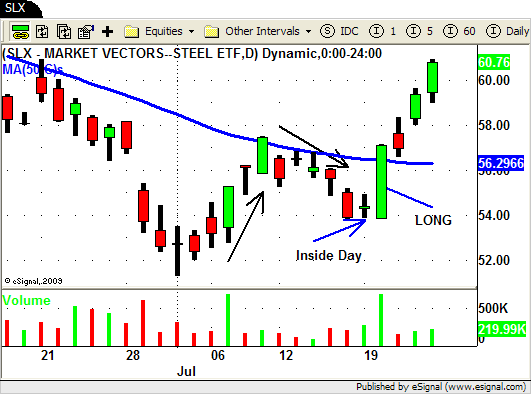
Tuesday's "gap and go" was CLEAR sign that SHORT was the wrong side on the market.

We were able to cover our SHORT in SLX for a tiny profit and our CLF SHORT at break even.

We not only covered our SHORT trade in SLX we actually flipped to the LONG side based on the context of the market and the sector itself.

SLX - Swing Trading ETF

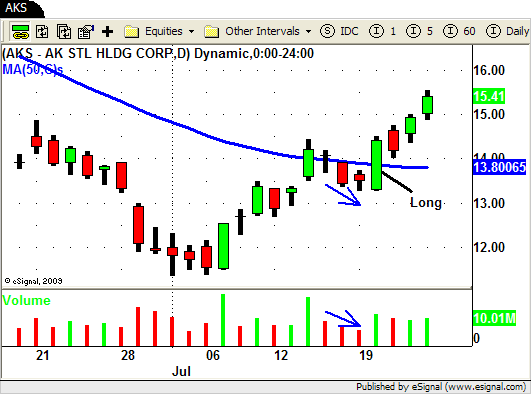
We did NOT flip to LONG in CLF but we did buy AKS since it had a stronger chart pattern.

Notice the LOW volume 3 day pullback prior to AKS ripping higher.

AKS - Swing Trade

Both SLX and AKS were trading at their 50 day SMA's and Tuesday UP move created a DOWN trend break out in both as they traded and closed above their 50 day SMA.

These were both "trend transition" type trades and may have been a little difficult for some traders to identify.

There were however plenty of STRONG stocks (trading ABOVE their 50 day SMA) to turn to once the market started its UP move.

Several chip stocks (ALTR, XLXN, MCHP, LLTC) were showing tremendous relative strength lately and offered up some nice trade setups.

Plenty of other stocks presented the same opportunity – HAL, ALK, CRM, AKAM, HMIN, NTAP, AXP, JNPR, and ATVI just to name a few.

Pull up the charts so you can see how these "strong" stocks reacted when the market pushed to the UP side.

Be prepared for anything and everything!

If you want to know exactly how we find the best Swing Trading Setups please join us at our upcoming webinar this Friday night!

You can register HERE!

Until next week…Good Trading to YOU!
Swing Trading Week in Review – July 16, 2010

Saturday, July 17th, 2010

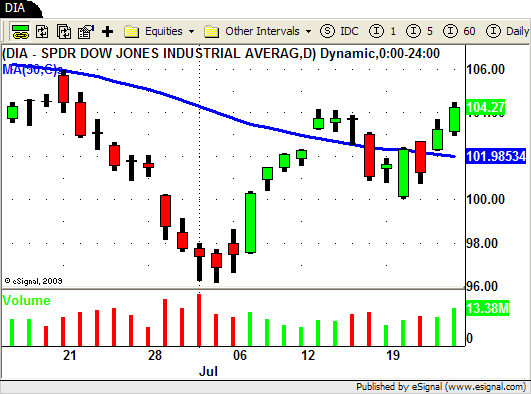
Another interesting week in the market!

After pulling back off of the recent lows the market heads back down as sellers aggressively drove the market down on Friday.

DJIA - Swing Trading

Last week we saw the market pullback on LOW volume so going into this week we were looking for signs that this "retrace" was losing steam.

Monday and Tuesday's price and volume action let us know that the overall market had NOT yet ended its retrace BUT some of the individual stocks and ETF's that were on our watch list told a different story.

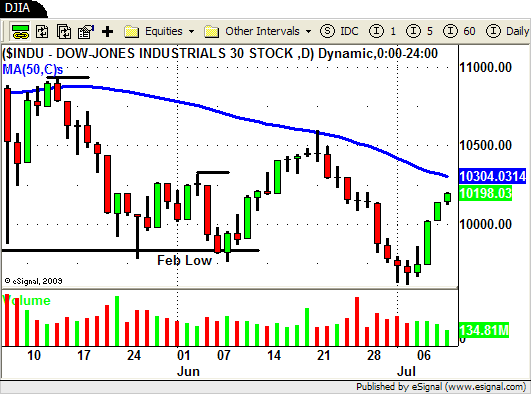
Since we have recently taken out the February lows in the market and we are still trading under the 50 day SMA our bias remains to the SHORT side for our "bread and butter" strategy.

In a perfect world we would be able to time our trades to match when the overall market makes its move but usually that is not the case.

Often times individual stocks (or specific sector ETF's) will lead the market by moving prior to the overall market.

In a down trending environment we often see the "weakest" stocks start to move lower even as the market is moving slightly higher.

The opposite is true for a up trending market.

"Strong" stocks will often breakout well before the overall market gives you confirmation that it is going higher.

We saw this happen at the beginning of the week as several of the stocks on our watch list triggered a SHORT entry signal.

Monday the market started to head lower but ended up closing near its high albeit on lower volume.

When the market gapped up on Tuesday some of our SHORT positions moved UP with right along with it.

The gap up in these stocks was of some concern but most stayed well below our initial STOP LOSS levels so we simply held  our positions.

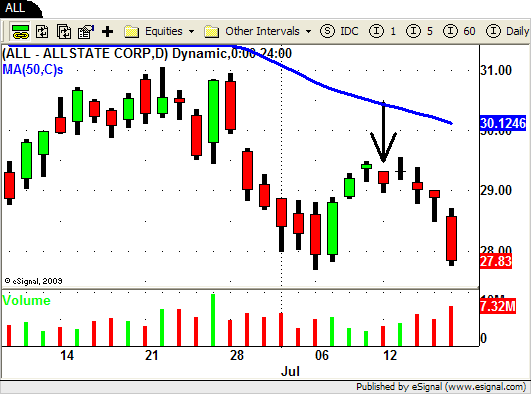
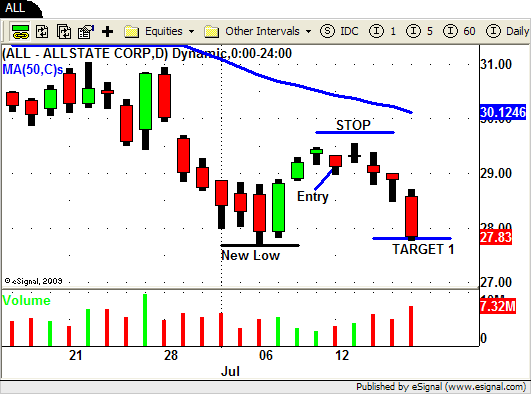
Allstate (ALL) is one our trades that triggered on Monday.

ALL - Short Swing Trade

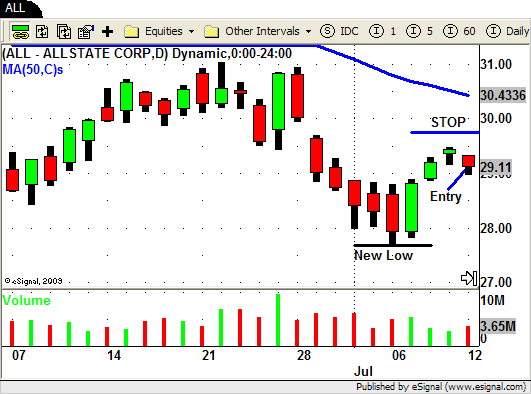
After hitting new yearly lows last week ALL put in a nice LOW volume 3 day retrace at the end of last week.

Monday you can see how ALL traded through Friday's low on increasing volume.

Our SHORT entry was triggered and we set our initial STOP LOSS level at $29.87 which is 1 ATR ( .77) away from our entry ($29.10).

ALL - Short Swing Trade

It is important to note here that by using the Average True Range (ATR) of the stock we were able to position our stop above an area where a chart pattern based stop would have been placed.

Using our Average True Range (ATR) again we would use a multiple of 2 (2 x .77= $1.54) to set our profit target at $27.57 ($29.20 – $1.54= $27.56).

However based on the chart we set our initial PROFIT TARGET at $27.78 which is just above the previous Swing Low at $26.68.

This is not quite a 2:1 risk/reward  but we put our target just above the possible support level and would cover a portion of our position at this level and let the remaining shares run.

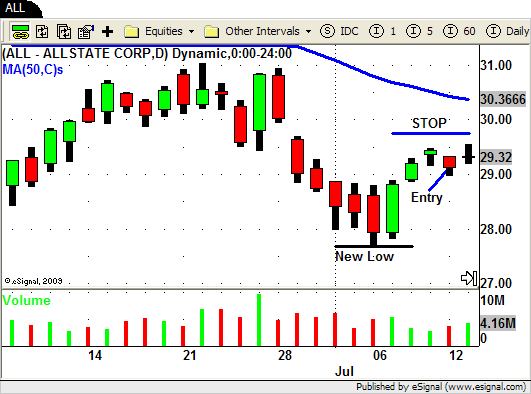
Tuesday you can see how ALL gapped up a bit with the overall market but stays well below our ATR based stop.

ALL - Short Swing Trade

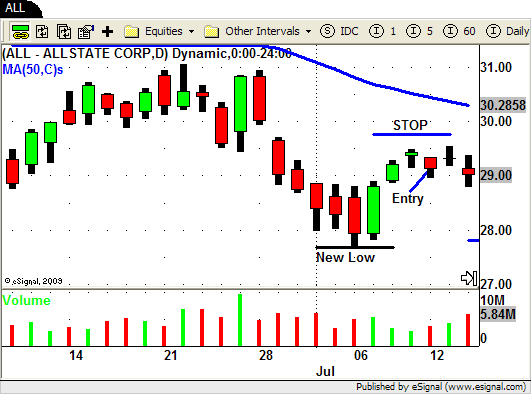
Wednesday ALL finally follows through to the down side and volume increases even as the overall market holds up.

ALL - Swing Trading

The end of the week brings more more of the same and near the close on Friday ALL hits profit target #1 as the market sells off.

ALL - Short Swing Trade

Some of the other stocks on our list that turned out to be good SHORT trades were APC, ZION, CLF, and SLX.

There were a lot of trades this week and its hard to go over them all in this BLOG.

At our "Indicators and Oscillators" webinar last night we went through each and every one of our trades.

We analyzed trades in MOS, AKAM, ALTR, XLNX, and ETF's like DXD, SRS and SKF.

We discussed how we use our indicators in conjunction with price action, volume and trend lines to make our trading decisions.

Based on the feedback we received it was a very insightful webinar for you short term traders!

Our next webinar is our popular "Swing Trading Weekly Wrap Up" where we do more of the same.

We analyze the market and sector ETF's and go over our trades in detail.

Please bring your questions and the symbols of the stocks or ETF's you want to discuss.

We look forward to seeing you there!

Until next week…Good Trading to YOU!
Swing Trading Week in Review – July 9, 2010

Sunday, July 11th, 2010

Swing Trading Blog Post –

This week the markets put in a pretty decent "pullback" off of the recent lows.

After such an extended and fast down move during the last 2 weeks this type of trading action should have been no surprise.

Here is how the chart of the DJIA looks after Friday's close.

DJIA

Taking everything into account this week was NOT the week to ENTER into any NEW short positions.

As a matter of fact if you swing trade using price action and volume then the charts were telling you this.

After 2 weeks of basically straight down trading we were looking for signs that the market was losing steam.

After being closed on Monday the markets gapped up Tuesday morning.

This was the first sign for us that the market MAY be starting to retrace off of its recent low.

The market did close "weak" on Tuesday BUT price held above the low of Friday AND the volume was light.

This was a good sign to us that the short term sentiment could be changing.

By seeing this type of price and volume action on the chart you had a few options depending on your trading style.

If you only trade one side of the market and you were already SHORT then you could have tightened up your trailing stops.

If you are a bit more advanced then you could use a "STOP and REVERSE" type trading strategy by getting out of your SHORT positions and entered into LONG positions (in the same stocks or ETF's) to trade the "bounce" or "pullback".

Although trading both sides of the market can be very profitable it does take a complete understanding of how price and volume work together in the context of trends.

You also should understand that by trading both sides of the market that often times you are taking trades against the main trend.

Lets take a look at the chart of the Energy Sector ETF (XLE) to show you what I mean…

XLE Swing Trading ETF

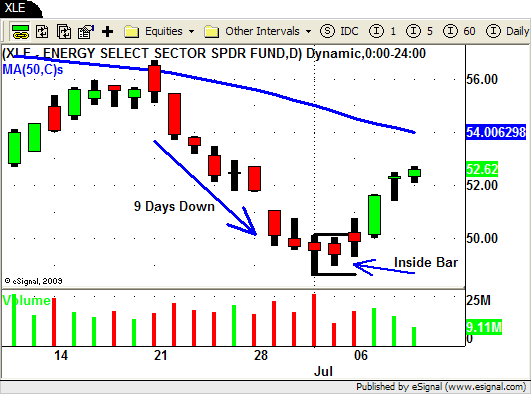
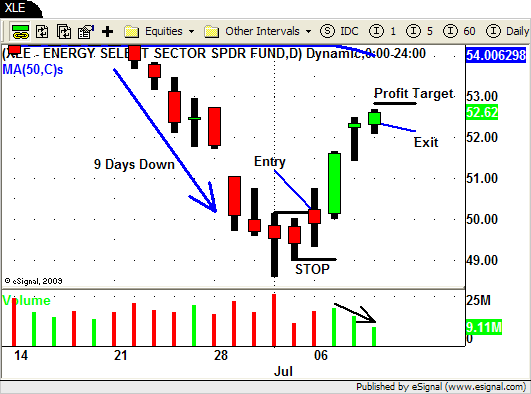
After trading down for 9 days straight we are looking for signs that the current down move may be coming to an end.

Last Friday you can see how XLE creates an "inside bar" on low volume.

This type of "stalling" price action can often times be the first clue in identifying sentiment changes.

As the market gapped up on Tuesday XLE gapped up above the high of both Thursday and Friday.

After such an extended move down (9 days) this type of chart pattern is something you would expect to see at the start of a retrace.

We need to understand though that this retrace is in a currently DOWN TRENDING market.

If you enter into a LONG position here you will be doing so AGAINST THE MAIN TREND.

Knowing that you will be be trading against the trend we strongly recommend that you make sure that you use a tight stop and a smaller profit target.

We use a 2:1 profit target for most of our SST (Short Term Swing Trades) including this one.

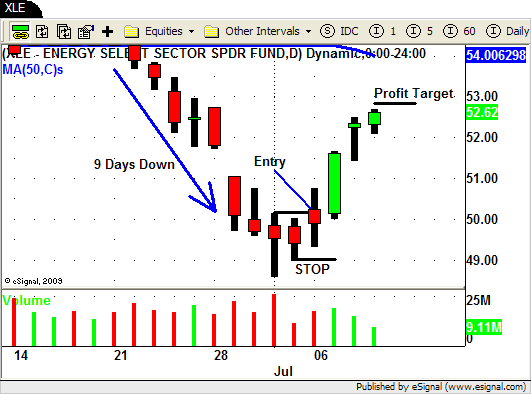
That being said our entry signal was on the open on Tuesday at $50.24.

XLE Swing Trade

Our initial STOP was placed just below the low of the "inside bar" at $48.94.

That gives use a risk of $1.30/share (50.24 – 48.94 = 1.30).

We then set our PROFIT TARGET $2.60 ($1.30 x 2 = $2.60) above our entry price at $52.84.

With our initial STOP and PROFIT TARGET in place we now move into managing our trade by watching price and volume.

Wednesday price moves HIGHER on INCREASED VOLUME…so far so good!

Thursday price moves higher yet again BUT volume decreases as does the intraday range.

We hold since price moves higher but the CAUTION light is flashing.

Friday price moves higher again BUT volume drops again and so does the range.

XLE trades as high as $52.70 (.14 from out PROFIT TARGET) and we end up exiting our position near the close at $52.64.

XLE Swing Trade

As of the close on Friday XLE looks to be putting in a classic retrace from its recent low.

Price is moving higher as volume and range is decreasing.

No one knows what Monday's market will do and XLE could continue to move higher.

By trading just .14 away from our profit target this was "good enough" for us and we will take our profits and run.

Take a look some of the stocks and ETF's on your list and see if you can spot how price and volume gave you a heads to the short term sentiment change we saw last week.

And as always if you have any question please feel free to post them below.

Until next week…Good Trading To YOU!


© Swing Trading Boot Camp 2024